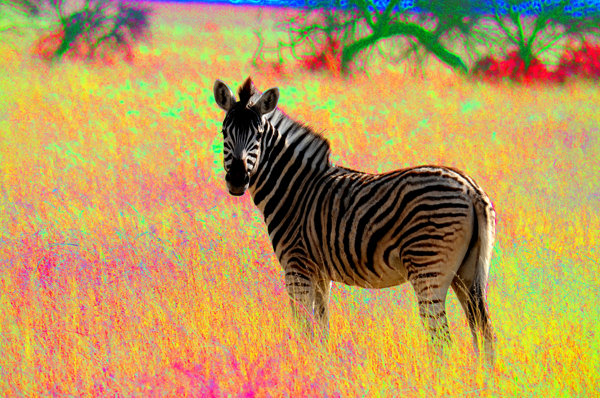
Out Standing in the Field
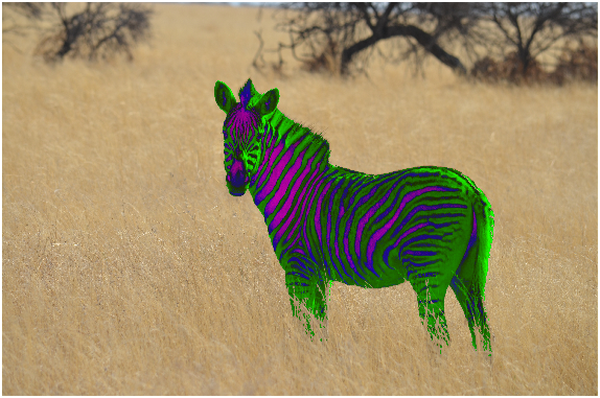
In the three previous entries in this guest series (part 1, part 2, part 3) I've worked my way through some approaches to creating special image effects with MATLAB. I started easy, and increased the difficulty level as I progressed. In this fourth post, I'm going to create the zebra image above. You might guess that doing so will entail segmenting the zebra--certainly the most difficult part of this problem.I previously wrote that I can usually get a good segmentation mask working in on or more grayscale representations of a color image. While I stand by that statement, I will also say that sometimes color does provide good information with which to create a segmentation mask. In fact, I'm going to use color to segment the zebra in this image, and then use the manual masking approach (using the imfreehand- mediated approach I used in the previous post) to fine-tune the mask.
Segmenting by Color
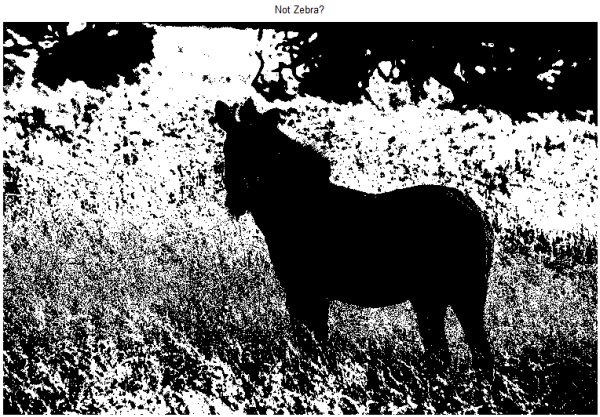
There are several approaches to segmenting using color information. If I wanted to create a mask of a single user-selected color, for instance, I could use impixelregion to explore colors in a region, or I could invoke impixel to click-select color samples.%Note that the |im2double| conversion conveniently scales the intensities to [0,1] URL = 'http://blogs.mathworks.com/pick/files/ZebraInField.jpg'; img = im2double(imread(URL)); figure, imshow(img); impixelregion
impixelregion provides a convenient tool for exploring the RGB (or grayscale) values underneath a small rectangle; as you drag that rectangle over your image, the intensity values are updated and displayed in a separate figure. In this image, for instance, we might recognize that the grass has an RGB intensity of roughly [0.75 0.65 0.5]. By specifying a "tolerance" of 0.05 (i.e., 5 percent of the color range) we can readily create a mask of "not-zebra" by selecting all pixels that have those approximate red, green, and blue values:
targetColor = [0.75 0.65 0.5];
tolerance = 0.05;
mask =...
  img(:,:,1) >= targetColor(1) - tolerance & ...
  img(:,:,1) <= targetColor(1) + tolerance & ...
  img(:,:,2) >= targetColor(2) - tolerance & ...
  img(:,:,2) <= targetColor(2) + tolerance & ...
  img(:,:,3) >= targetColor(3) - tolerance & ...
  img(:,:,3) <= targetColor(3) + tolerance;
figure,imshow(mask);title('Not Zebra?')
Recognize here that each of those constraints on the binary variable "mask" is simply an additional logical AND that I'm applying. I could easily provide different tolerances for ranges above and below each of R, G, and B. (A GUI with sliders might facilitate that interaction!) I could also create additional masks in a similar manner and combine them, using the logical OR operation, until I achieved the desired segmentation.
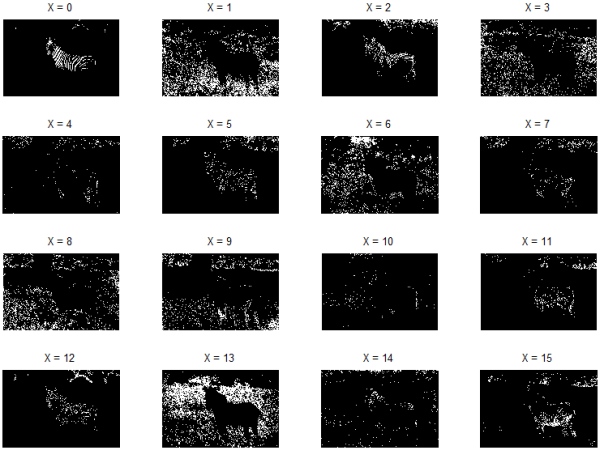
Instead of going down that path, though, I'd like to demonstrate another useful approach to color segmentation. In this approach, rather than manually selecting colors on which to base the segmentation mask, I'm going to let MATLAB do the work. The function rgb2ind quantizes an image into a user-specified number of colors. Each of those "quantum levels" can be used to create a unique mask of the image. For instance, here I quantize the zebra into 16 colors and display the binary mask that each index represents:
nColors = 16;
X = rgb2ind(img,16);
% (X ranges from 0 to nColors-1)
for ii = 0:nColors-1
    subplot(4,4,ii+1)
    imshow(ismember(X,ii));
    title(sprintf('X = %d',ii));
end
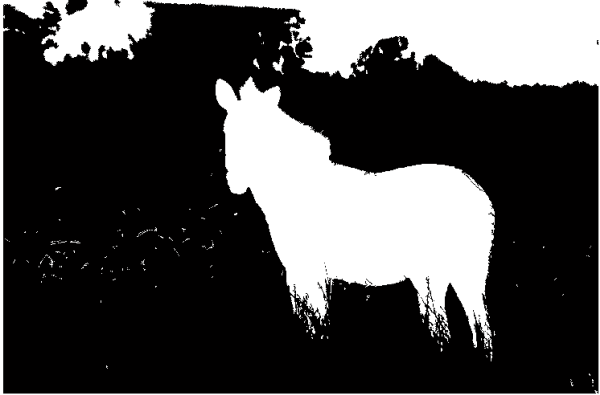
Now at a glance I can construct a segmentation mask of the zebra, selecting only the indices that have a significant component within the area of interest:
mask = ismember(X,[0,2,4,5,7,10:12,14,15]);
figure,imshow(mask)
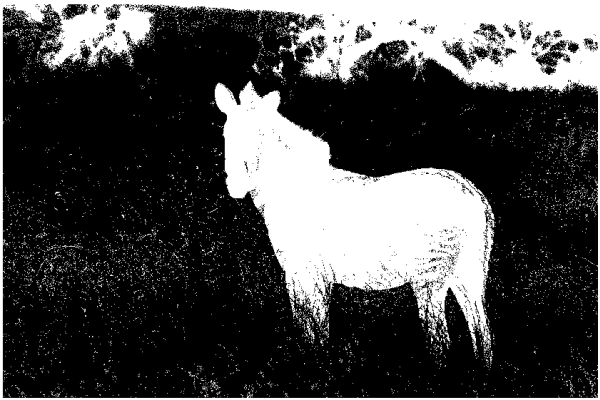
Clearly, there's a tradeoff between including more indices to "solidify" the zebra mask, and increasing the amount of background "noise" included in the segmentation. I like this as a starting point, so I'm going to use this and start refining:
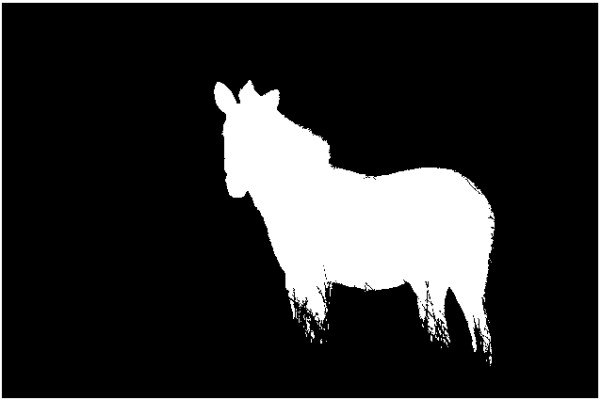
mask = bwareaopen(mask,100); %Remove small blobs
mask = imfill(mask,'holes'); %Morphologically fill holes
figure,imshow(mask)
Normally, I would use imclearborder to remove the large white region at the top of the image, and then, using regionprops, determine the areas of each connected blob. The documentation for regionprops shows how one could easily use that information to eliminate all but the largest object in the resulting image. (That would presumably leave only the zebra.) But in this case, that would also eliminate all the small isolated regions around the zebra's legs, and I would like to keep those. So instead, I'm going to quickly encircle the zebra using imfreehand, and use the resulting mask to eliminate all peripheral blobs.
manualMask = imfreehand;
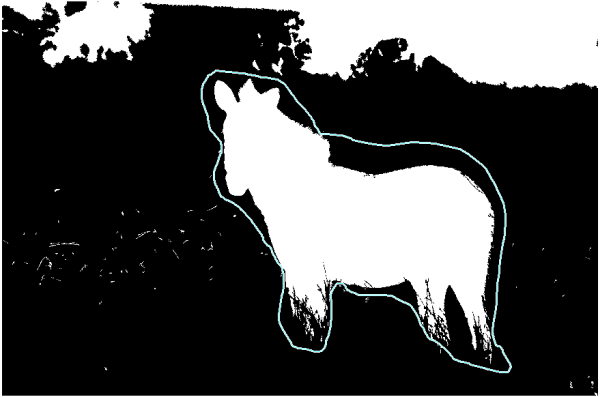
posns = getPosition(manualMask);
[m,n,~] = size(mask);
includeMask = poly2mask(posns(:,1),posns(:,2),m,n);
mask = mask & includeMask;
mask = imdilate(mask,strel('disk',2)); %Slight tweak here
imshow(mask);
Now to Use the Segmented Zebra
Yes! I like that mask, and can do a lot with it. Conveniently, the function roifilt2 allows me to operate on only a masked portion of an image. That function, though, only works on 2-D images--not on RGB images. However, when it makes sense to do so, I can modify the red, green, and blue planes indendently, and reconstruct the RGB image using cat. For instance:processImage{1} = @(x) imadjust(x,[0.05; 0.16],[1.00; 0.11], 1.20); %Red plane
processImage{2} = @(x) imadjust(x,[0.10; 0.83],[0.00; 1.00], 1.00); %Green plane
processImage{3} = @(x) imadjust(x,[0.00; 0.22],[1.00; 0.00], 1.10); %Blue plane
r = roifilt2(img(:,:,1),mask,processImage{1});
g = roifilt2(img(:,:,2),mask,processImage{2});
b = roifilt2(img(:,:,3),mask,processImage{3});
enhancedImg = cat(3,r,g,b);
figure,imshow(enhancedImg)
Creating the "normal" zebra in the pastel field is a bit trickier, since I can't do a decorrelation stretch plane-by-plane. So instead, I'm going to create the "pastel effect" using decorrstretch, and then reset the values underneath the masked zebra back to their original values.
imgEnhanced = decorrstretch(img); %Operating on the original image
% Now reset the red plane to the masked value of the original image
r = imgEnhanced(:,:,1); % Get the enhanced red plane
tmp = img(:,:,1); % Get the original red plane
%Replace the enhanced red under the mask with the original red:
r(mask) = tmp(mask);
% Same for green
g = imgEnhanced(:,:,2);
tmp = img(:,:,2);
g(mask) = tmp(mask);
% And blue
b = imgEnhanced(:,:,3);
tmp = img(:,:,3);
b(mask) = tmp(mask);
% Now reconstruct the enhanced image
imgEnhanced = cat(3,r,g,b);
% And tweak it with imadjust to intensify colors
imgEnhanced = imadjust(imgEnhanced,[0.1; 0.8],[0.00; 1.00], 1.00);
%figure, imshow(imgEnhanced); title('Voila!')
%(This reproduces the zebra at the top of this post!)